")
")

*By Nathaniel Mathew*
With 235,000 deaths and 9.6 million cases of infection in mid-autumn of 2020, the US stood disempowered before the rising rates of Covid-19 infection across the nation (1). Several factors contributed to the rise in infections across the U.S. such as ill-preparedness to combat the infection, slow defense strategies, insufficient education among the public, strained medical resources, and stormy politics of the nation’s leaders (2). While the immediate causes may seem many, the underlying pattern that connects it all is social behavior driven by public perception.
Current Infection Trends
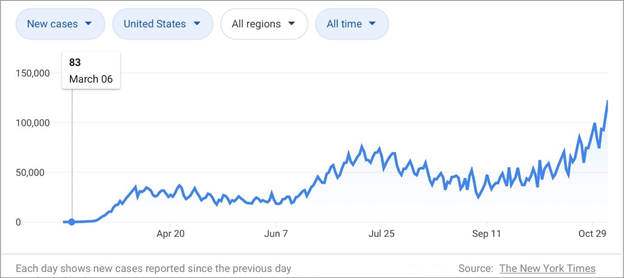
As evident from Fig 1, the US has seen two distinct waves of coronavirus infection with the third one in its expanding zone as of mid-autumn. The first cases were recorded in early March and the number of cases peaked in early April 2020. A month later, the infection rate dipped, but only to rise again by mid-July. The numbers fell to a low of 25,166 by September 07, 2020 only to further rise to the highest it has ever been by mid-autumn (1).
As of mid-autumn, the US has the highest number of confirmed infections across the world – over one-fourth the global count despite accounting for only 4% of the total population.
The Role of Bayes Theorem
In situations where the factors that collectively contributed to the outcome are varied in nature, a simple but powerful statistical equation can be introduced to shed some light on the impact on infection rates. Unlike most mathematical absolutes, this equation involves the calculation of the probability of an event A happening given the occurrence of event B. This fundamental concept was first introduced by Reverend Bayes in his paper “An Essay Toward Solving a Problem in the Doctrine of Chances (3).” It was posthumously published and called ‘Bayes Theorem’.
The theorem is stated below:
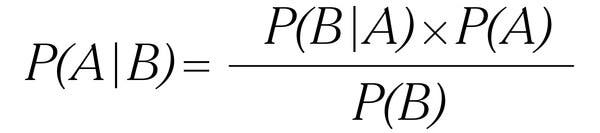
This theorem shows that the posterior outcome (left-hand-side of the equation) is directly proportional to the likelihood of an event occurring multiplied by the prior value.
Detection of Probability of Covid-19 Infection in an Individual using Bayes Theorem
At the onset of the viral infection, effective ways to determine infection in the public weren’t present. However, by mid-March, all fifty states were able to begin testing using kits obtained from the CDC or commercial labs. Due to the rapid and unstandardized ways of test production (4), the tests were subject to inaccuracies and defects, and therefore could not be considered 100% conclusive.
Bayes theorem can be used to determine the probability of an individual not having Covid-19 after being tested positive for the virus. This paper studies the impact of variations in each influencing factor on the probability of an individual in the US being Covid-19 positive given a positive test result. Five independent scenarios are considered to understand the impact. In the Current Scenario, the mid-autumn 2020 infection rate and test efficacy numbers are taken into consideration making this scenario the control against which all other scenarios will be compared. In Scenario 1, the average infections per day are significantly
reduced from 150,000, in the Current Scenario, to 50,000 considering better containment and social distancing measures. In Scenario 2, the number of false positives is brought down from 1 in 500 to 1 in 1000 considering greater standardization and improved accuracy of tests. In Scenario 3, the number of false negatives is brought down to 5% considering greater standardization and improved accuracy of tests. In Scenario 4, the optimal conditions from Scenarios 1, 2, and 3 are considered which includes reduced incident of Covid-19 infection in the population and increased test efficacy resulting in reduction of false positives and false negatives.
Current Scenario: Based on Mid-autumn Data
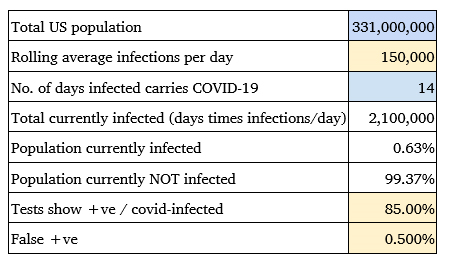
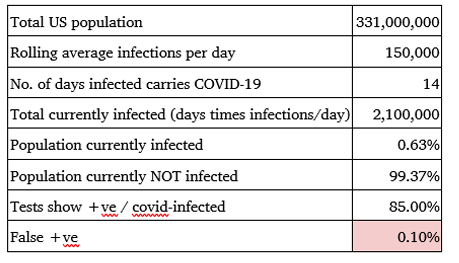
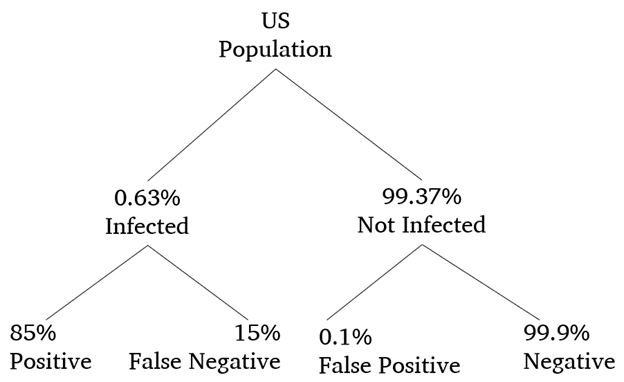
The US population rests at approximately 331 million of which an average of 150,000 Covid-19 positive cases are reported on a daily basis as of mid-autumn (1). Assuming that the infectiousness of the virus in each individual last for around 14 days (5), the average US population that will be infected at the end of 14 days can be assumed to be 2.1 million. This means that the percentage of population infected can be estimated to be 0.63% while the population not infected is at 99.37%. Assuming that the tests are 85% accurate with only 0.5% testing false positive, as outlined in Table 1, the probability of Covid-19 infection in an individual can be determined using Bayes theorem.
Color Key:
The assumptions can be represented in the following manner:

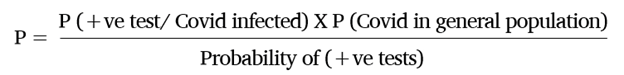
On applying these assumptions to Bayes theorem, the probability of an individual having Covid-19 given their last test was positive can be represented as:

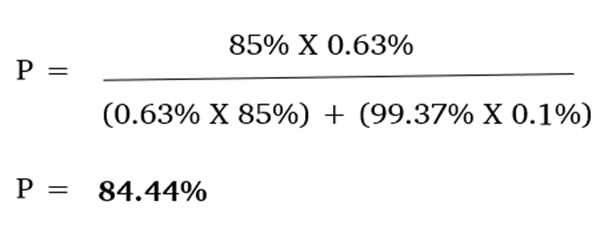
Upon substituting the above equation with the estimated values, you get:

Based on this application of Bayes theorem, even if a person tests positive, he or she has only a 52.05% chance of being infected by Covid-19. This means that 47.95% of the time an individual tests positive, they are in reality Covid-19 negative.
Scenario 1: Based on Hypothetical Reduction in Daily Infection Rate
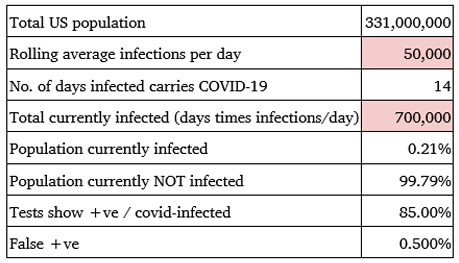
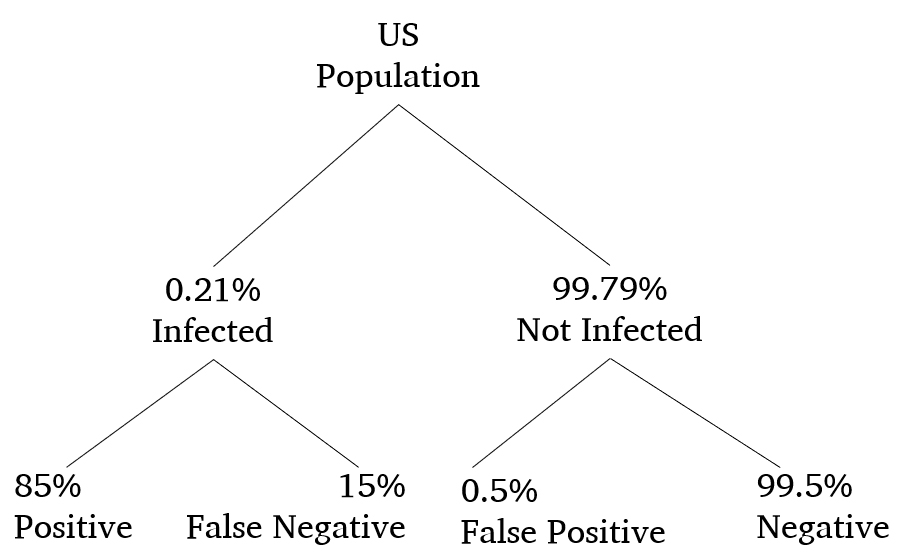
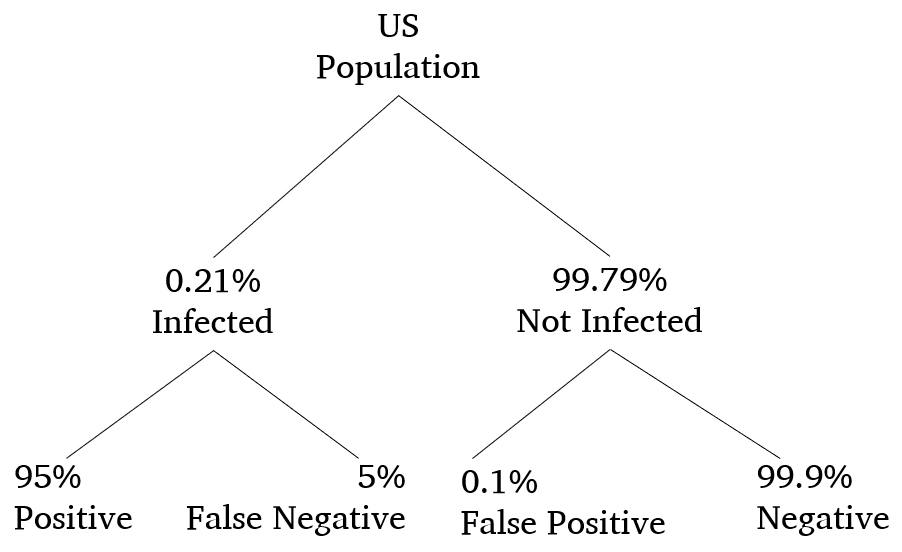
Considering that the US population is at 331 million, if the rate of daily Covid-19 infections can be brought down from the 150,000 per day, as in the Current Scenario, by better social distancing and hygiene practices to 50,000 per day, then the average US population that will be infected at the end of 14 days can be assumed to be 0.7 million. This means that the percentage of population infected can be estimated to be 0.21% while the population not infected is at 99.79%. Assuming that the tests are 85% accurate with only 0.5% testing false positive, as outlined in Table 2, the probability of Covid-19 infection in an individual can be determined using Bayes theorem.
The assumptions can be represented in the following manner:
Bayes theorem for determining the probability of infection in a Covid-19 positive individual can be represented in the following manner:

Upon substituting the above equation with the estimated values, you get:

Based on this application of Bayes theorem, even if a person tests positive, he or she has only a 26.49% chance of being infected by Covid-19. This Scenario shows that if the infected population is reduced without significant changes in test efficacy, the possibility of being infected after being tested positive is halved when compared to the Current Scenario.
Scenario 2: Based on Mid-autumn Data Considering Reduced Incidence of False Positives
The US population rests at approximately 331 million of which an average of 150,000 Covid-19 positive cases are reported on a daily basis. Assuming that the infectiousness of the virus for each individual last for around 14 days, the average US population that will be infected can be assumed to be 2.1 million. This means that the percentage of population infected can be estimated to be 0.63% while the population not infected is at 99.37%. Assuming that the test efficacy has increased from the Current Scenario of 1 in 500 to only 1 in 1000 testing false positive, as outlined in Table 3, the probability of Covid-19 infection in an individual changes from the value expressed in the Current Scenario.
Color Key:
The assumptions can be represented in the following manner:
On applying these assumptions to Bayes theorem, you get the following equation:
Upon substituting the above equation with the estimated values, you get:
Based on this application of Bayes theorem, even if a person tests positive, he or she has a 15.56% chance of not being infected by Covid-19. Thus, it is evident that if the number of false positives is brought down to 1 in a 1000, the reliability of tests goes up by around 1.6 times as when compared with the Current Scenario.
Scenario 3: Based on Mid-auumn Data Considering 95% Accuracy in Test Results
The US population rests at approximately 331 million of which an average of 150,000 Covid-19 positive cases are reported on a daily basis. Assuming that the infectiousness of the virus for each individual last for around 14 days, the average US population that will be infected can be assumed to be 2.1 million. This means that the percentage of population infected can be estimated to be 0.63% while the population not infected is at 99.37%. Assuming that the test accuracy has increased from 85% to 95% of tests giving accurate positive detection, as outlined in Table 4, the probability of Covid-19 infection can be calculated as given below.
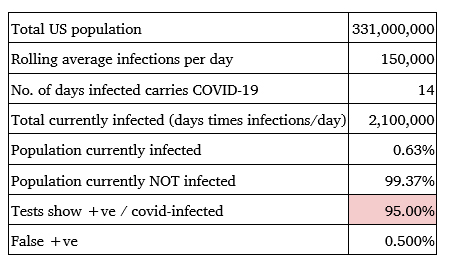
Color Key:
The assumptions can be represented in the following manner:
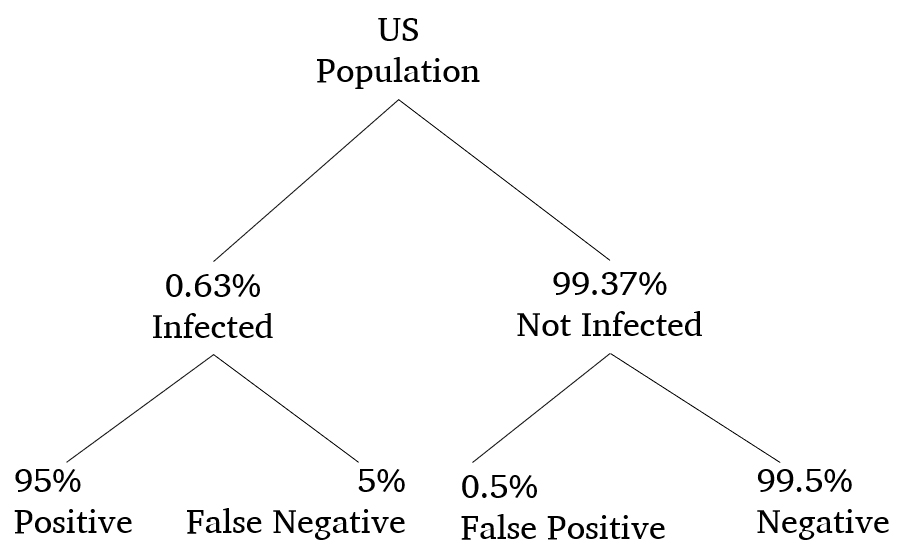
On applying these assumptions to Bayes theorem, you get the following equation:

Upon substituting the above equation with the estimated values, you get:
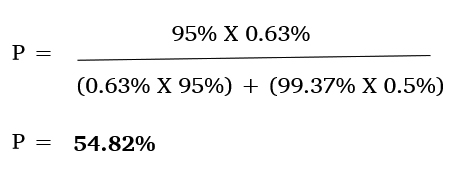
Based on this application of Bayes theorem, even if a person tests positive, he or she has a 45.18% chance of not being infected by Covid-19. This shows that the effect of improvement in accuracy of tests on the probability of Covid-19 infection in an individual is negligible with only a slight improvement of 2.77% over the Current Scenario value of 52.05%.
Scenario 4: Based on Optimal Conditions
Considering that the US population is at 331 million, if the rate of daily Covid-19 infections can be brought down from 150,000, in the Current Scenario, to 50,000 per day by better social distancing and hygiene practices, then the average US population that will be infected at the end of 14 days can be assumed to be 0.7 million. This means that the percentage of population infected can be estimated to be 0.21% while the population not infected is at 99.79%. Assuming that the test accuracy has increased from 85% in the Current Scenario with 95% of tests giving accurate positive detection and only 1 in 1000, as opposed to 1 in 500 in the Current Scenario, showing false positives, as outlined in Table 5, the probability of Covid-19 infection can be calculated as given below.
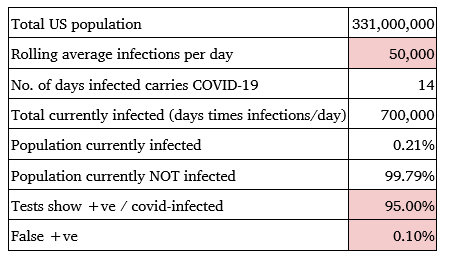
Color Key:
The assumptions can be represented in the following manner:
On applying these assumptions to Bayes theorem, you get the following equation:

Upon substituting the above equation with the estimated values, you get:

Based on this application of Bayes theorem, even if a person tests positive, he or she has a 33.19% chance of not being infected by Covid-19. This scenario shows that when optimal conditions of reduced infection rate with increased efficacy of tests by the reduction of false positives and false negatives is considered, the accuracy of Covid-19 detection is 1.28 times better than that in the Current Scenario.
The Effect of Public Perception on Social Behavior
As the rate of infection continues to rise unchecked and the prospects of greater spread looms over the winter of 2020 in the US, the question of who or what was responsible for the uncontrolled outbreak surfaces with pressing importance. To what extent did the change in public perspective result in the current dynamic increase in the number of cases as opposed to the first wave? Is it possible that after the first wave of fear subsided and more information about methods of spread and age-associated fatality became available, people lowered their guard and disregarded social distancing protocols? Or maybe they mimicked top politicians in their disregard for using masks as tools of protection and containment? Could it be that the heat drove people in masses to engage in outdoor activities once the lockdown was withdrawn? Or perhaps it was isolation fatigue that drove people to gather in crowds and socialize? Maybe all of these reasons contributed to some degree. What can be agreed upon is that social behavior influenced by changing public perception played a major role in the rapid escalation of infections.
Proposed Bayes Theorem Application in Predicting Covid-19 Infection Across a Larger Population
Bayes theorem can be further applied to determine the rate of infection in specific communities by considering the various factors that increase chances of infection within the population.
The rate of infection of Covid-19 is not only dependent on viral susceptibility but is also affected by social interactions, culture, socioeconomic class, weather, use of protection such as masks and sanitizers (6), etc. These can all be called likelihoods.
If data can be collected within a control group of a certain locality, culture, economic class, political affinity, and age group of people based on their level of outdoor activities and adherence to social distancing protocol, the likelihood of infection among the control group can be determined. This information when combined with existing rates of infection can be used to make projections about the updated rate of infection within a larger population that is a scaled-up version of the control group. Using the new and updated infection rate, steps can be taken to prepare for and contain the upcoming spread within the target community.
Conclusion
Bayesian statistics is a melody of hierarchical probability changes where each variable is influenced by fluctuating parameters chronologically. Thus, each variation can influence the end result. What makes Bayesian statistics a perfect application for this pandemic situation is its capacity to accommodate the randomness and multitude of factors influencing the outcome to provide a safe range of 95% probability window to work with until new data surfaces.
Bayes theorem has varied applications. It has been used to generate models for epidemiology, conduct search-and-rescue operations, locate sunken ships and missing aircrafts, identify the author of a literary work, and even to win wars. A form of Bayes theorem was used to crack the Enigma code that was used by Germans during the Word War II, bringing the war to a quick end and saving many lives (7). It’s potential role in bringing the current pandemic under control is monumental.
References
1. Covid in the U.S.: Latest Map and Case Count. The New York Times. [Online] November 10, 2020. https://www.nytimes.com/interactive/2020/us/coronavirus-us-cases.html.
2. William Wan, Jacqueline Dupree. Coronavirus cases are rising in U.S., sparking worries the next big wave has begun. Washington Post. [Online] October 14, 2020. https://www.washingtonpost.com/health/2020/10/13/coronavirus-cases-rising/.
3. Bayes, Thomas. LII. An essay towards solving a problem in the doctrine of chances. By the late Rev. Mr. Bayes, F. R. S. communicated by Mr. Price, in a letter to John Canton, A. M. F. R. S. The Royal Society Publishing. [Online] January 01, 1763. https://royalsocietypublishing.org/doi/10.1098/rstl.1763.0053.
4. Shmerling, Robert H. Which test is best for COVID-19? Harvard Health Publishing. [Online] August 10, 2020. https://www.health.harvard.edu/blog/which-test-is-best-for-covid-19-2020081020734.
5. Coronavirus Disease 2019 (COVID-19). Centers for Disease Control and Prevention. [Online] May 13, 2020. https://www.cdc.gov/coronavirus/2019-ncov/symptoms-testing/symptoms.html.
6. S. Lakshmi Priyadarsini, M. Suresh. Factors influencing the epidemiological characteristics of pandemic COVID 19: A TISM approach. Taylor & Francis Online. [Online] April 20, 2020. https://www.tandfonline.com/doi/full/10.1080/20479700.2020.1755804?af=R.
7. Mcgrayne, Sharon Bertsch. The Theory That Would Not Die: How Bayes’ Rule Cracked the Enigma Code, Hunted Down Russian Submarines, and Emerged
1. Covid in the U.S.: Latest Map and Case Count. The New York Times. [Online] November 10, 2020. https://www.nytimes.com/interactive/2020/us/coronavirus-us-cases.html.
2. William Wan, Jacqueline Dupree. Coronavirus cases are rising in U.S., sparking worries the next big wave has begun. Washington Post. [Online] October 14, 2020. https://www.washingtonpost.com/health/2020/10/13/coronavirus-cases-rising/.
3. Bayes, Thomas. LII. An essay towards solving a problem in the doctrine of chances. By the late Rev. Mr. Bayes, F. R. S. communicated by Mr. Price, in a letter to John Canton, A. M. F. R. S. The Royal Society Publishing. [Online] January 01, 1763. https://royalsocietypublishing.org/doi/10.1098/rstl.1763.0053.
4. Shmerling, Robert H. Which test is best for COVID-19? Harvard Health Publishing. [Online] August 10, 2020. https://www.health.harvard.edu/blog/which-test-is-best-for-covid-19-2020081020734.
5. Coronavirus Disease 2019 (COVID-19). Centers for Disease Control and Prevention. [Online] May 13, 2020. https://www.cdc.gov/coronavirus/2019-ncov/symptoms-testing/symptoms.html.
6. S. Lakshmi Priyadarsini, M. Suresh. Factors influencing the epidemiological characteristics of pandemic COVID 19: A TISM approach. Taylor & Francis Online. [Online] April 20, 2020. https://www.tandfonline.com/doi/full/10.1080/20479700.2020.1755804?af=R.
7. Mcgrayne, Sharon Bertsch. The Theory That Would Not Die: How Bayes’ Rule Cracked the Enigma Code, Hunted Down Russian Submarines, and Emerged Triumphant from Two Centuries of Controversy. s.l. : Yale University Press, 2011.
